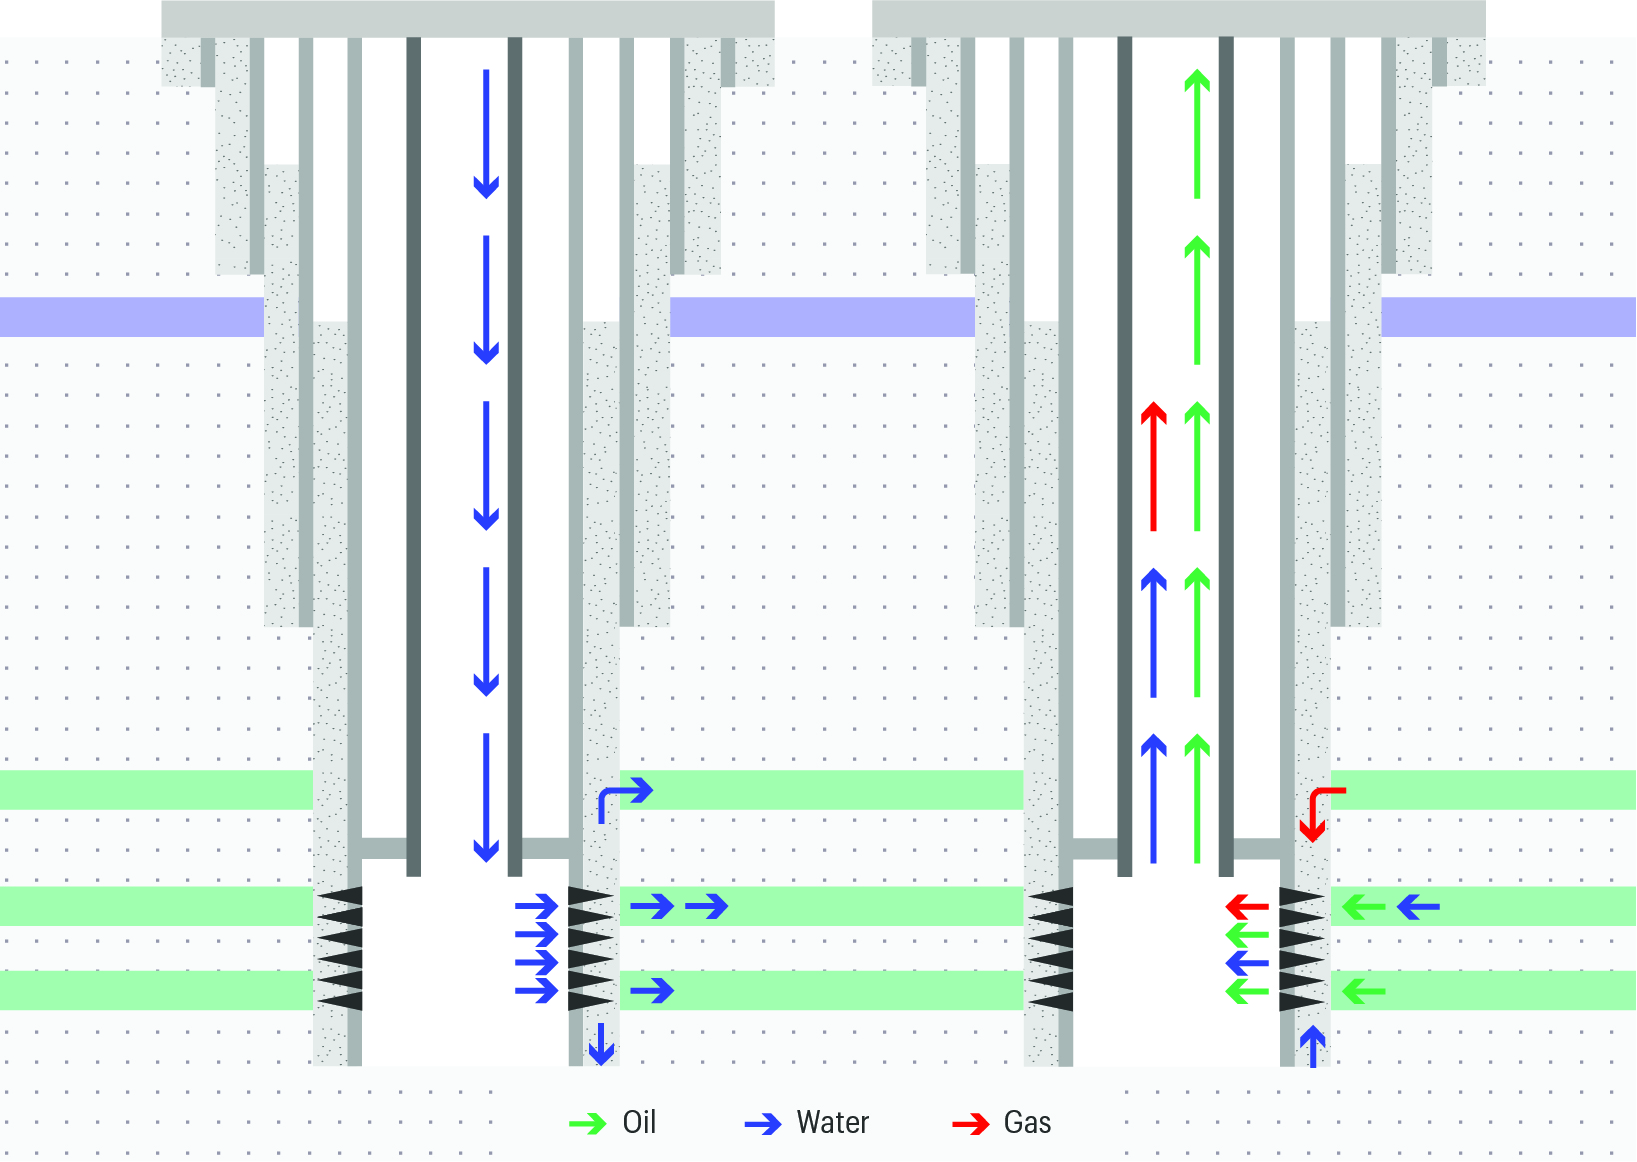
As part of a wider programme to enhance oil recovery, an operator of an offshore Abu Dhabi field wanted to obtain a more detailed understanding of fluid movement in and around their producer wells and identify the source of unwanted water. The diagnostic results would provide insights to support future decisions about reservoir management, remedial work and optimum workovers, and would shape the plans for drilling new wells.
- Location Abu Dhabi
- Well Type Oil producer
- Reference SPE 161712
Case benefits
-
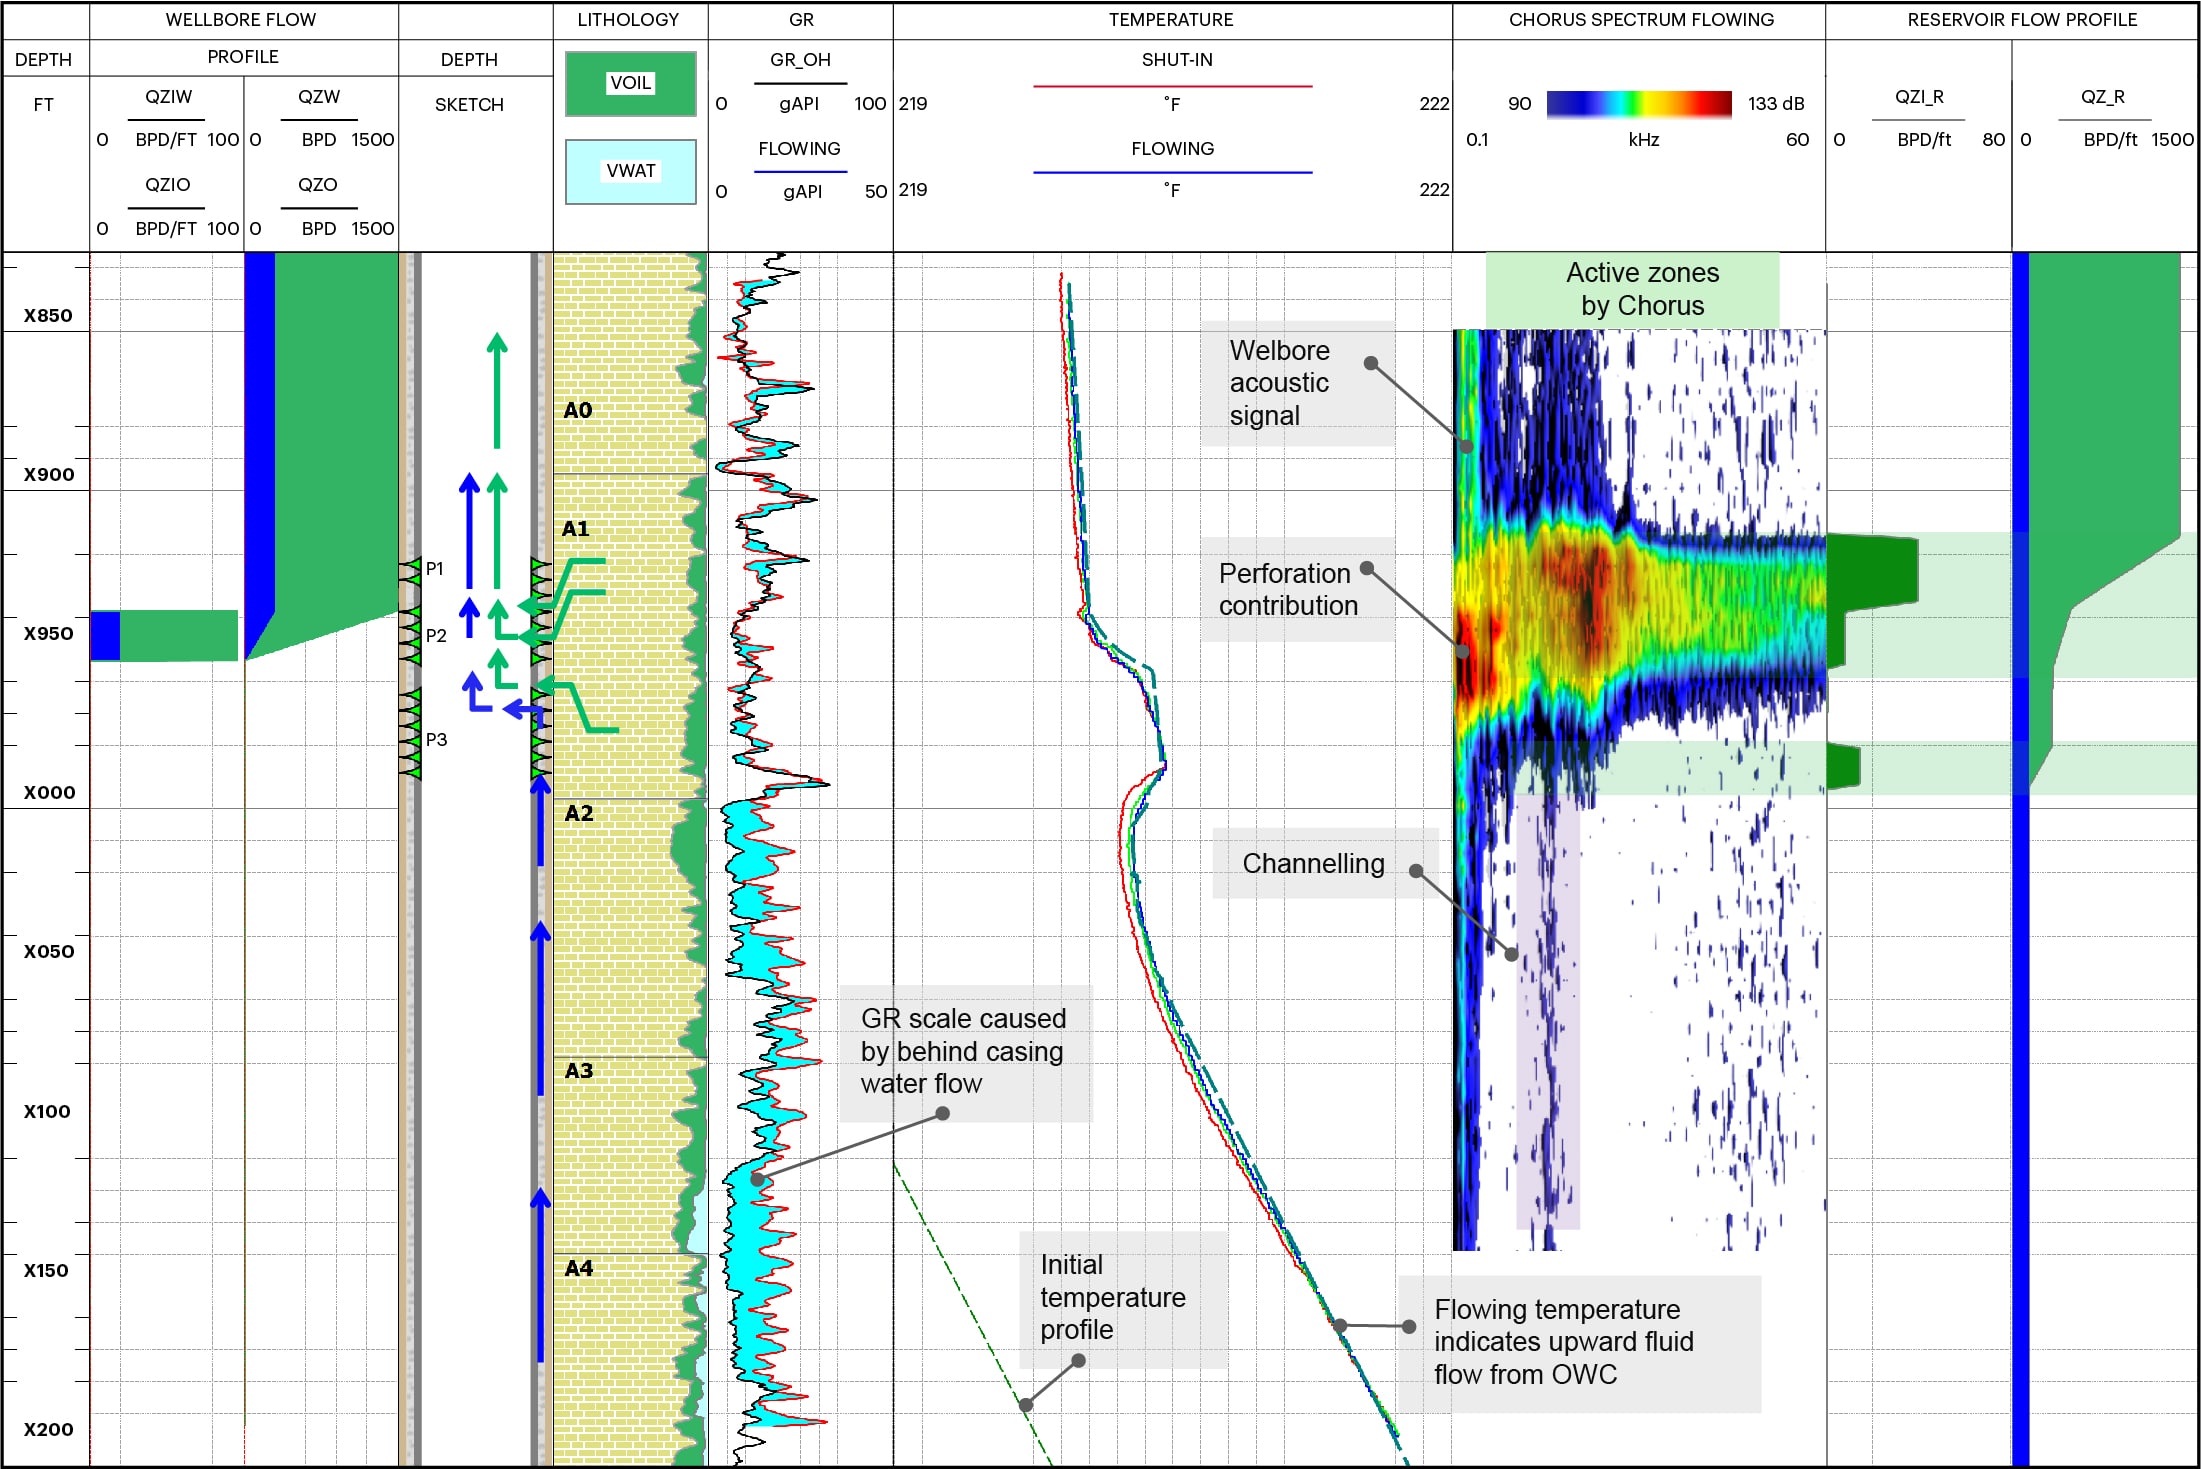
Determined and quantified both flowing (including low-rate) and bypassed reservoir zones not involved in production
-
Located the water source
-
Detected inter-reservoir communication behind casing
(through channel in cement)
-
Defined fluid entry points