Home Resources CS028 Total Flow
Case study
Providing an accurate multiphase flow profile behind tubing to guide workover planning
Total Flow Resource ID: CS028

Challenge

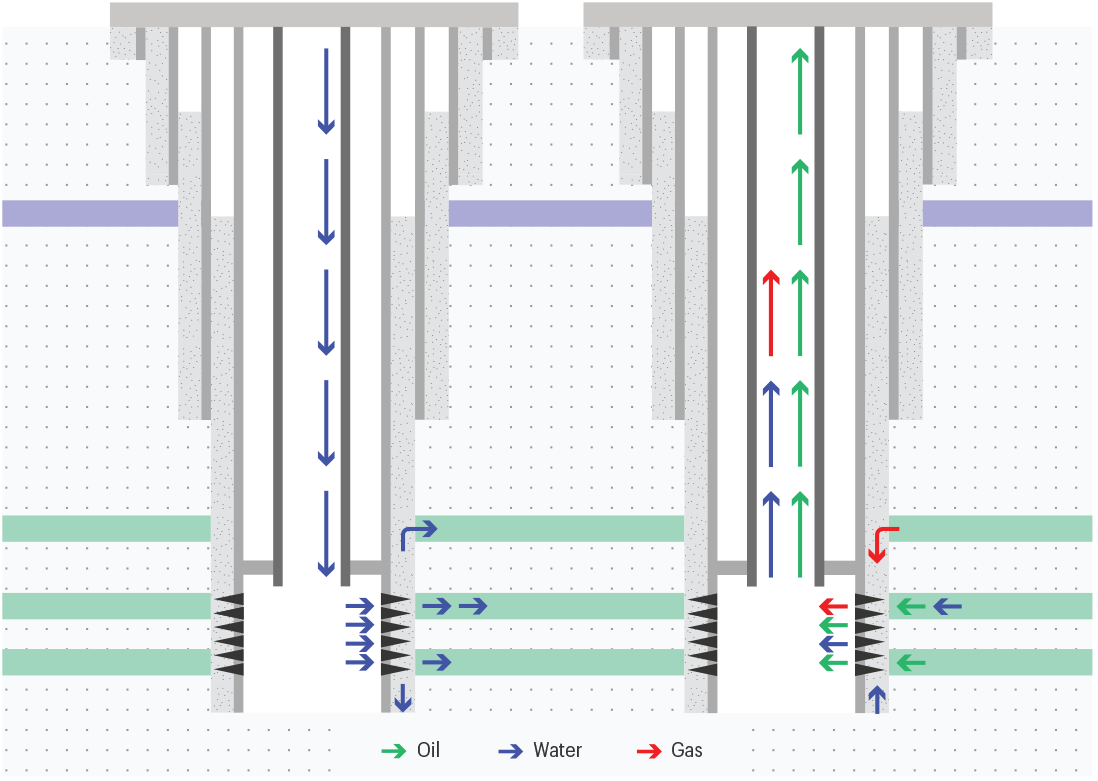
The subject well was not reaching its planned gas production rate, so the field operator wanted to investigate the issue and identify the root cause. The assumption was that both the hydraulically fractured reservoir zones were contributing to production, thus the first task was to assess the relative contributions of gas from each layer. Water production was also an issue and can be a critical problem in a gas well. The second challenge was, therefore, to identify where water was entering the well in order to plan a workover operation. 


The tubing installed in this gas producer well extends below the bottom perforation interval, which means that conventional production logging tool surveys cannot help with evaluation.

CS028 Total Flow well sketch
Total Flow is commonly used to diagnose unexpected or undesirable well system behavior, but it can also be used proactively to ensure the well system is working properly.

Solution

The subsurface team of reservoir and petroleum engineers at AGL Energy Ltd selected TGT’s Total Flow product to locate and quantify wellbore and reservoir flow and reveal the relationship between the two. Delivered by the True Flow system with Chorus and Cascade technology, Total Flow provides the clarity and insight operators need to manage well-system performance more effectively. Total Flow is commonly used to diagnose unexpected or undesirable well-system behaviour, but it can also be used proactively to ensure that a well system is working properly.


In this case, the combination of Cascade flow modelling and Chorus acoustic sensing enabled TGT analysts to generate an accurate multiphase flow profile for the well and provide the operator with a clear picture of what was happening behind the casing and below the survey interval.

CS028 Total Flow_Logplot
The maximum survey depth during the flowing regime was X204 m, which means that the bottom perforated interval (X207–X209 m) was not surveyed. The TFM curve shown in the TEMPERATURE track is the modelled flowing temperature profile. It is matched with TEMP_F1D1 down to the maximum surveyed depth and shows the assumed temperature behaviour below this depth.

Result

The temperature simulation and flow modelling results from TGT’s Cascade platform identified the main inflow zones and showed that 48% of total gas and 44% of total water were entering the well from the bottom perforated interval. This indicated that about 93% of the total gas flow rate and 100% of the water was from the bottom-zone Wallabella Sandstone Formation. The upper fractured zone (the Tinowon reservoir) was not making a significant contribution to gas production, thus the well could not reach its planned production performance.


The operators can apply these insights to develop an effective plan for future workover and stimulation tasks.


The small volume of gas produced from the Lower Tinowon Sandstone Formation is the result of behind-casing channelling, which would not have been identified by conventional production logging tools.