Home Resources CS004 Total Flow
Case study
Flow diagnostics locates diverted injection water and helps operator improve injection performance
Total Flow Resource ID: CS004

Challenge

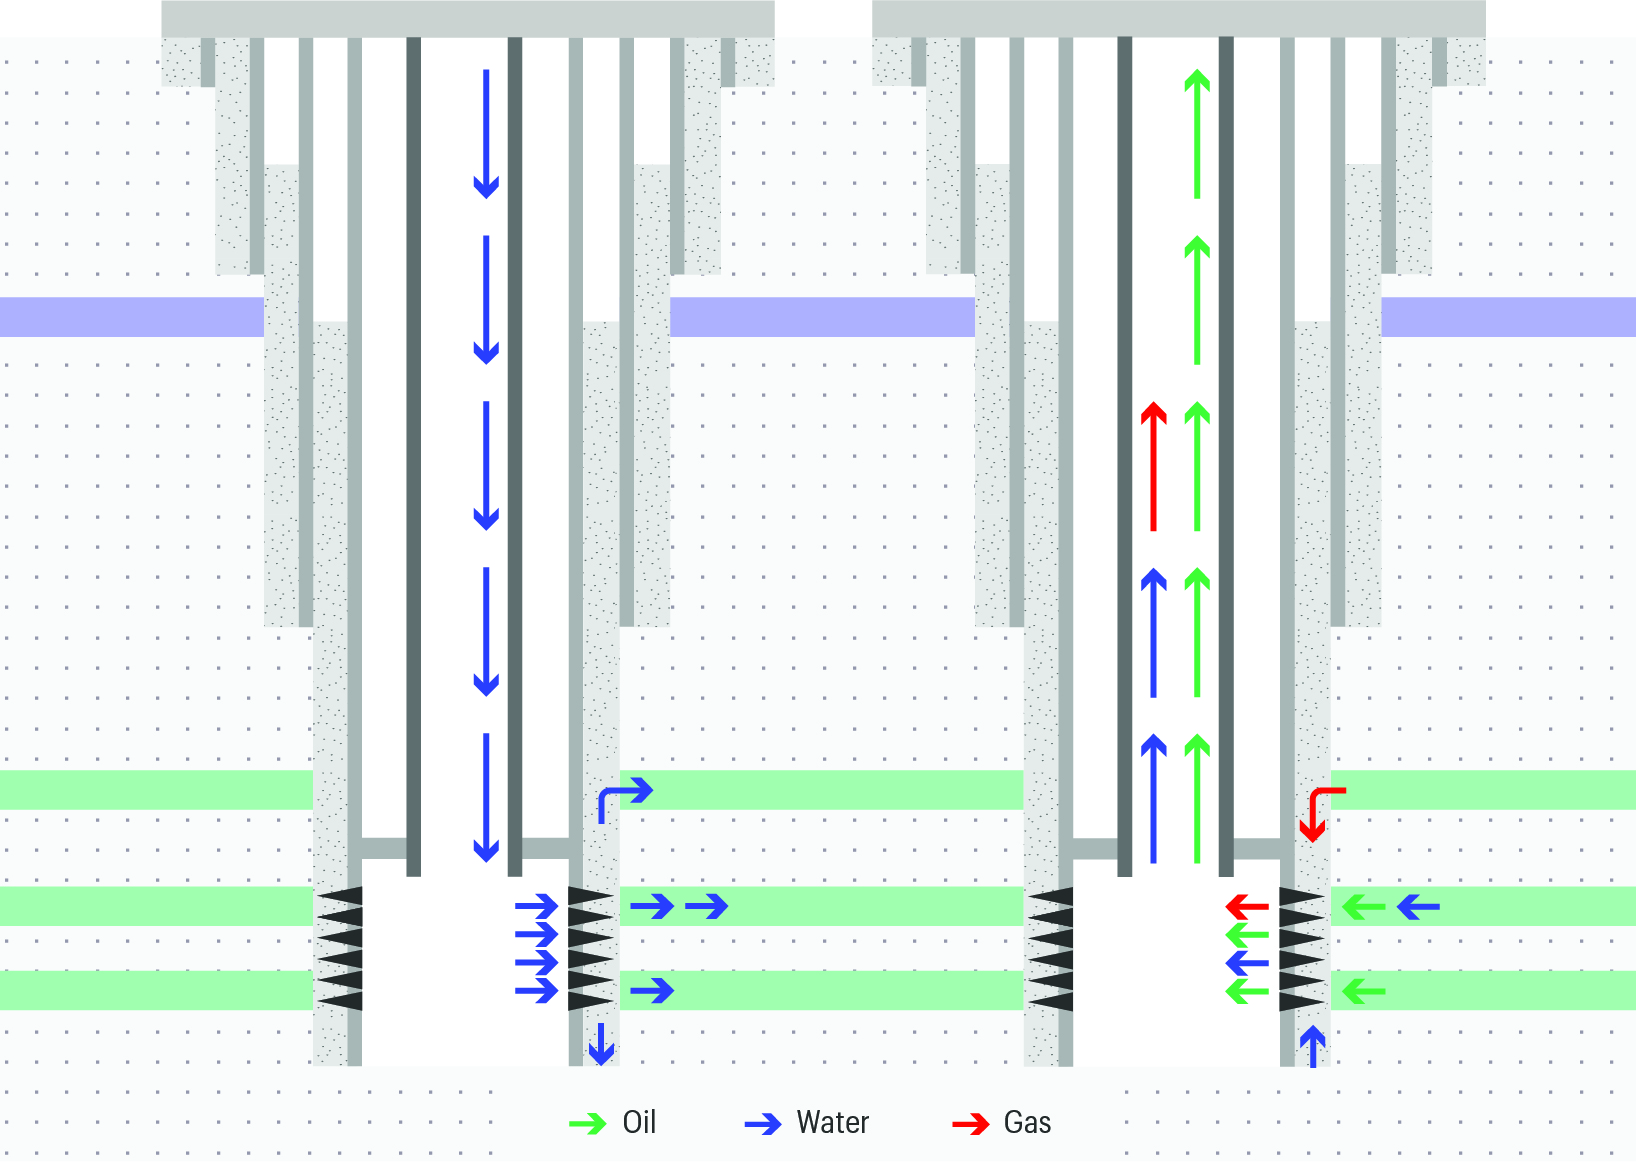
Petroleum and reservoir engineers determine that if water is injected at a particular pressure, then target reservoirs will receive a certain volume of water over time. If the predicted flow rate isn’t observed, then either something is wrong with the assumptions, or something is wrong with the well system—or both. Even worse, the predicted flow rate may be within range, but the water may not be reaching the target. The latter scenario is particularly insidious because it may be weeks, months or longer before an alarm is raised.


An operator was experiencing injection issues and needed to confirm whether the injected water was reaching the target reservoir.

Total-Flow-well-sketch
Total Flow locates and quantifies wellbore and reservoir flow, and reveals the relationship between the two.

Solution

TGT’s ‘Total Flow’ product was selected to explain the flow dynamics of the well system and uncover where the injected water was ultimately going. Total Flow is delivered by the ‘True Flow’ diagnostic system.


TGT’S diagnostic systems combine technology platforms that share a common structure and workflow, namely ‘programmes & methods’, ‘tools & measurements’, ‘processing & modeling’ and ‘analysis & interpretation’.


The True Flow diagnostic system uses four platforms: Chorus, Cascade, Indigo and Maxim, and each has a specific role.
Chorus is used to record and analyse the acoustic energy produced by fluid flow throughout the well system. Its role in this case was to help analysts pinpoint flow activity behind casing. Cascade uses proprietary thermofluid modeling to calculate flow profiles throughout the well system, and Indigo provides a number of complementary measurements, including temperature and conventional production logging information [PLT]. Maxim is the digital workspace where analysts develop the pre-survey diagnostic programme and carry out post-survey processing, data integration, modeling and data analysis.


The diagnostic programme in this case called for the well system to be surveyed in flowing and non-flowing states in order to expose the active flowing zones.

CS004-Total-Flow-Logplot
True Flow diagnostics in this injection well show that 75% of injected water was bypassing the target reservoir through behind-casing flowpaths.

Result

The diagnostic results revealed that only 25% of the injected water was reaching the target reservoir A3. The other 75% was flowing to four behind-casing formation layers in A2, and A4 respectively (See logplot).


The Chorus flowing spectrum clearly shows the injection flow activity in each of the five formations, and Cascade modeling has quantified the respective flow rates. Open hole data confirmed that formation layers above the target zone were water filled and the analyst concluded that the injected water was flowing through behind casing cement channels. This was supported by the continuous acoustic energy spectrum from A3 to the top of A2.


Equipped with an accurate and complete flow diagnostic of the well system, the operator was able to target an effective remediation plan.