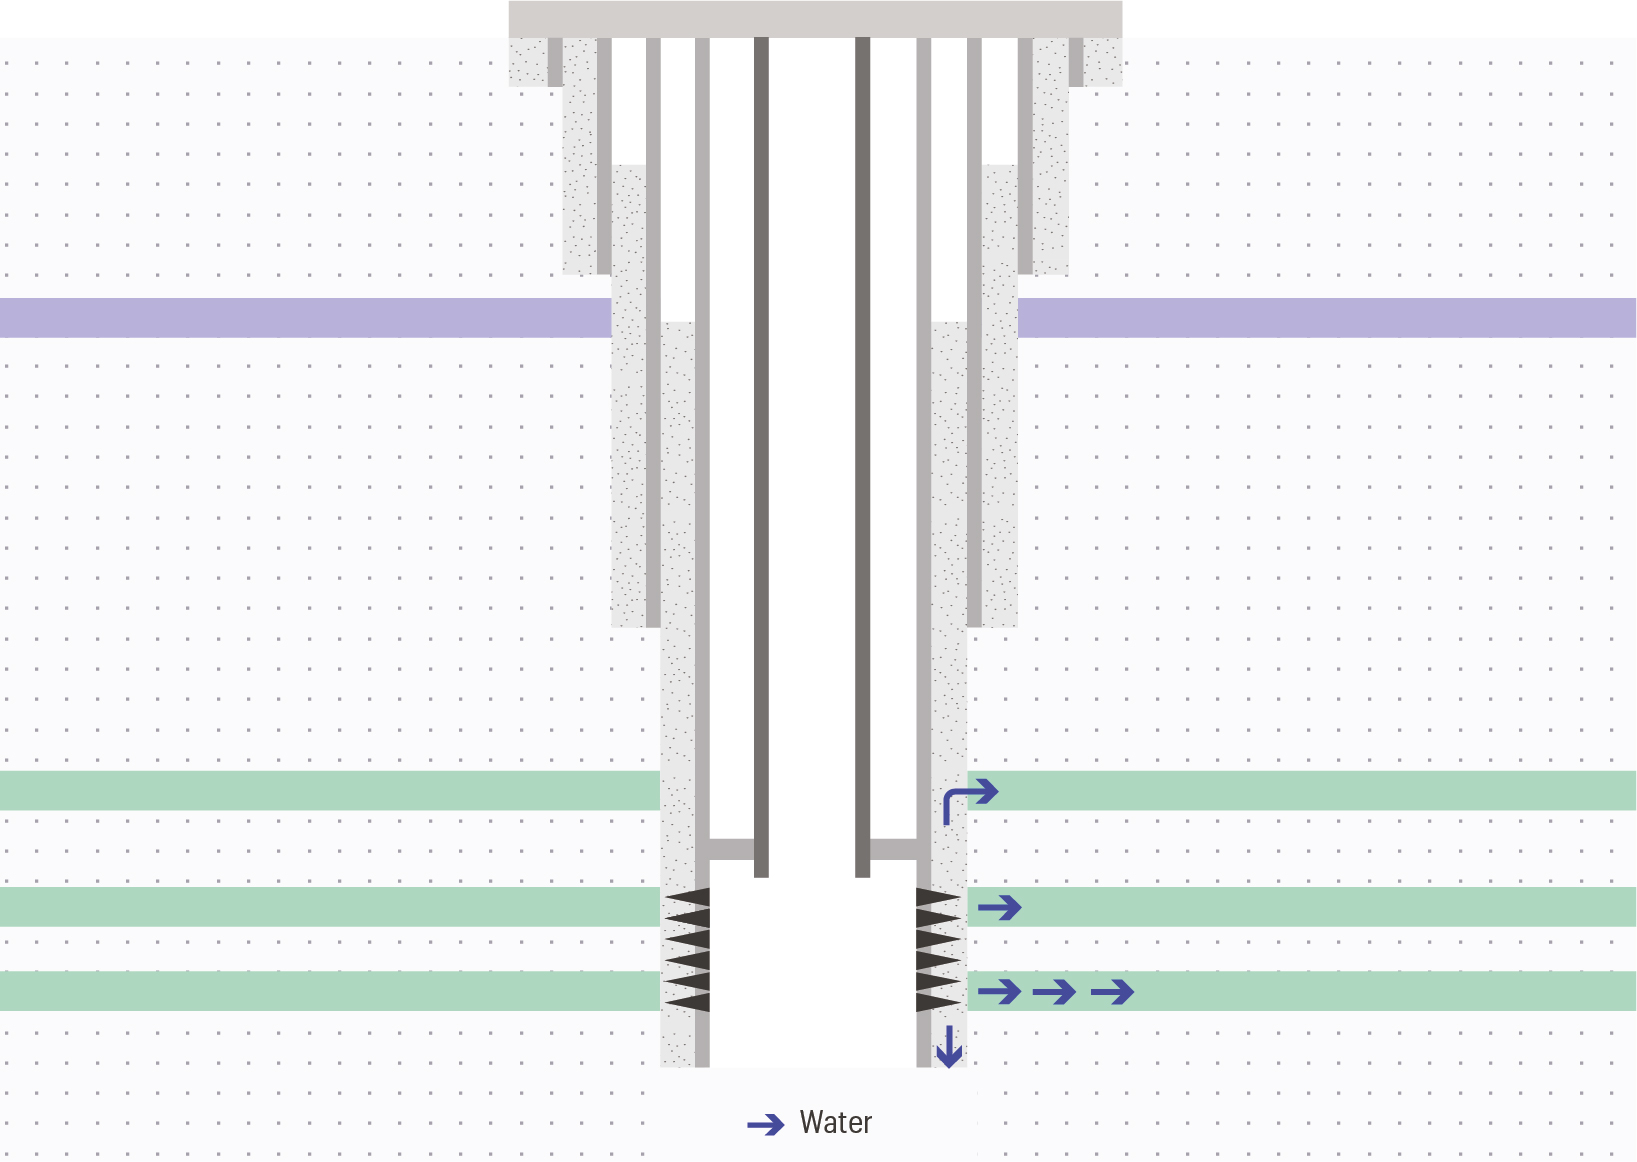
Waterflooding contributes approx. 45% of the total production in the Sirikit field and will continue to play a key role in the future. Improvements in waterflood performance would have a positive impact on financial performance, but waterflood optimisation requires a clear understanding of the injection profile with the water distribution in the reservoir.
- Location Thailand
- Well Type Water injector
- Reference SPE-191011
Case benefits
-
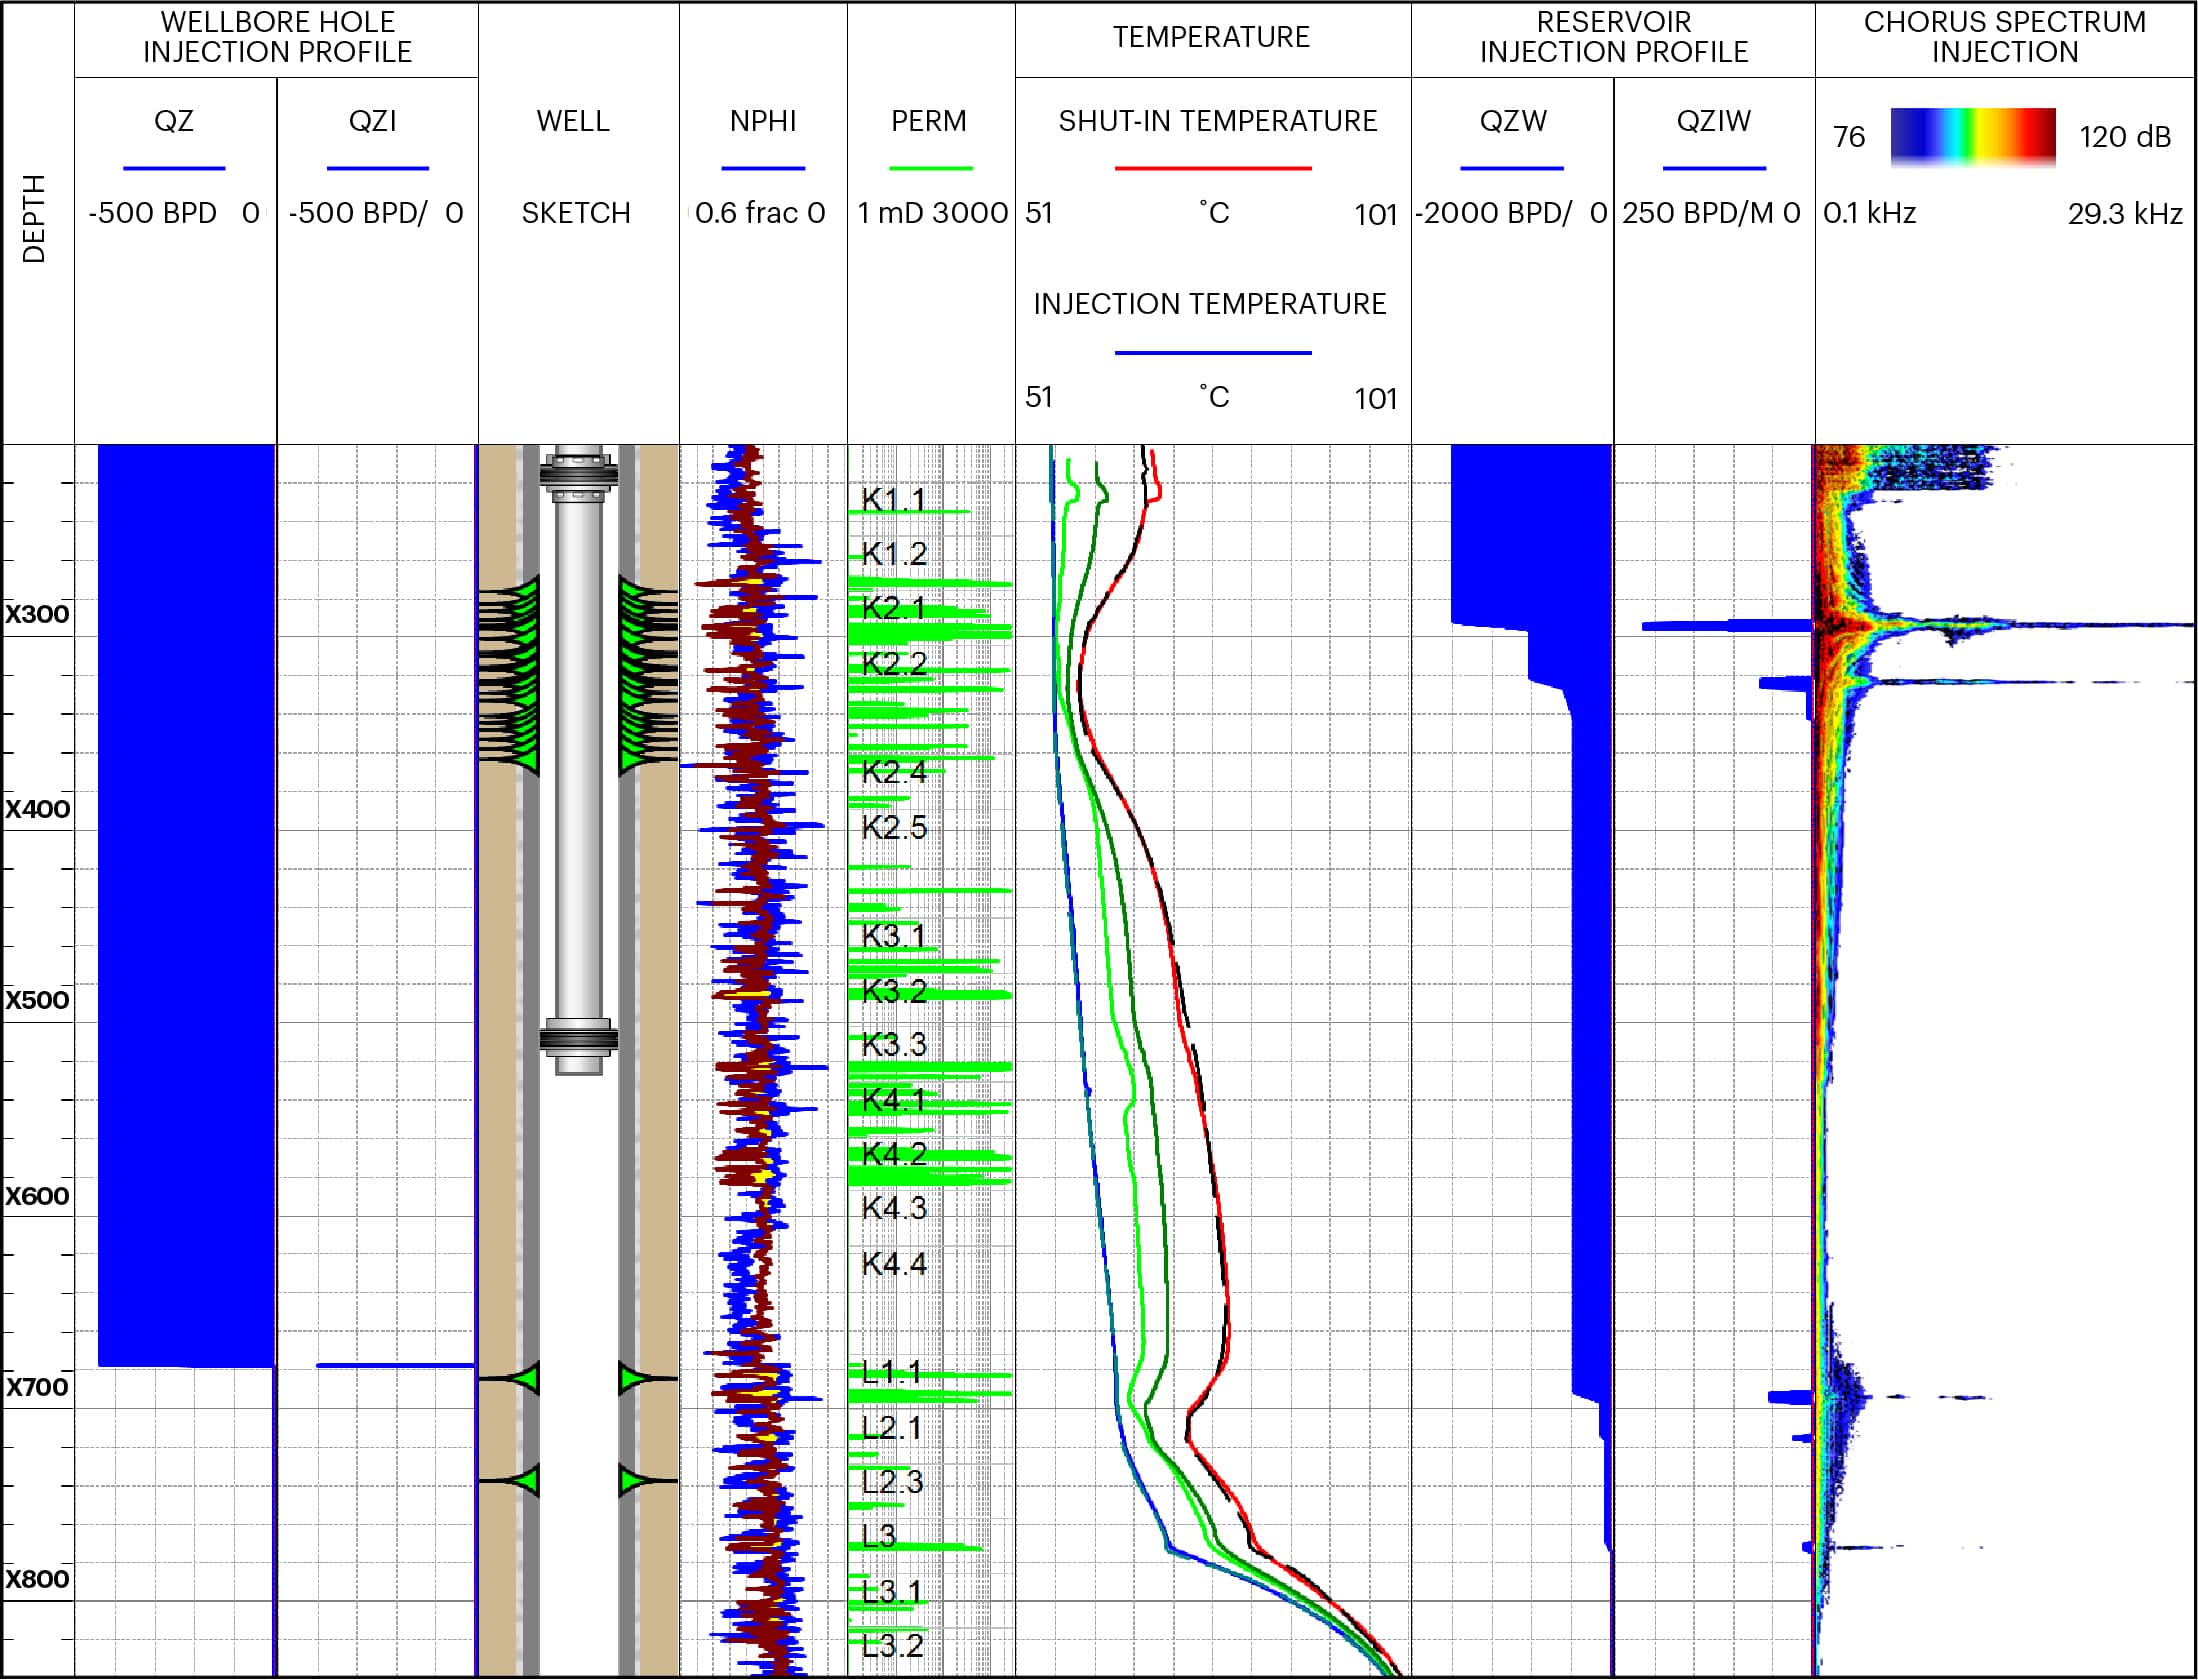
Identified active layers using the Chorus acoustic platform
-
Provided information for potential zonal isolation or recompletion programs to enable the operator to optimise waterflood performance
-
Calculated injection profiles with the aid of thermal simulations