Home Resources CS003 Total Flow
Case study
Flow diagnostics find source of high water cut behind casing
Total Flow Resource ID: CS003

Challenge

Identifying the source of high water-cut is one of the most urgent priorities for petroleum and reservoir engineers to resolve.


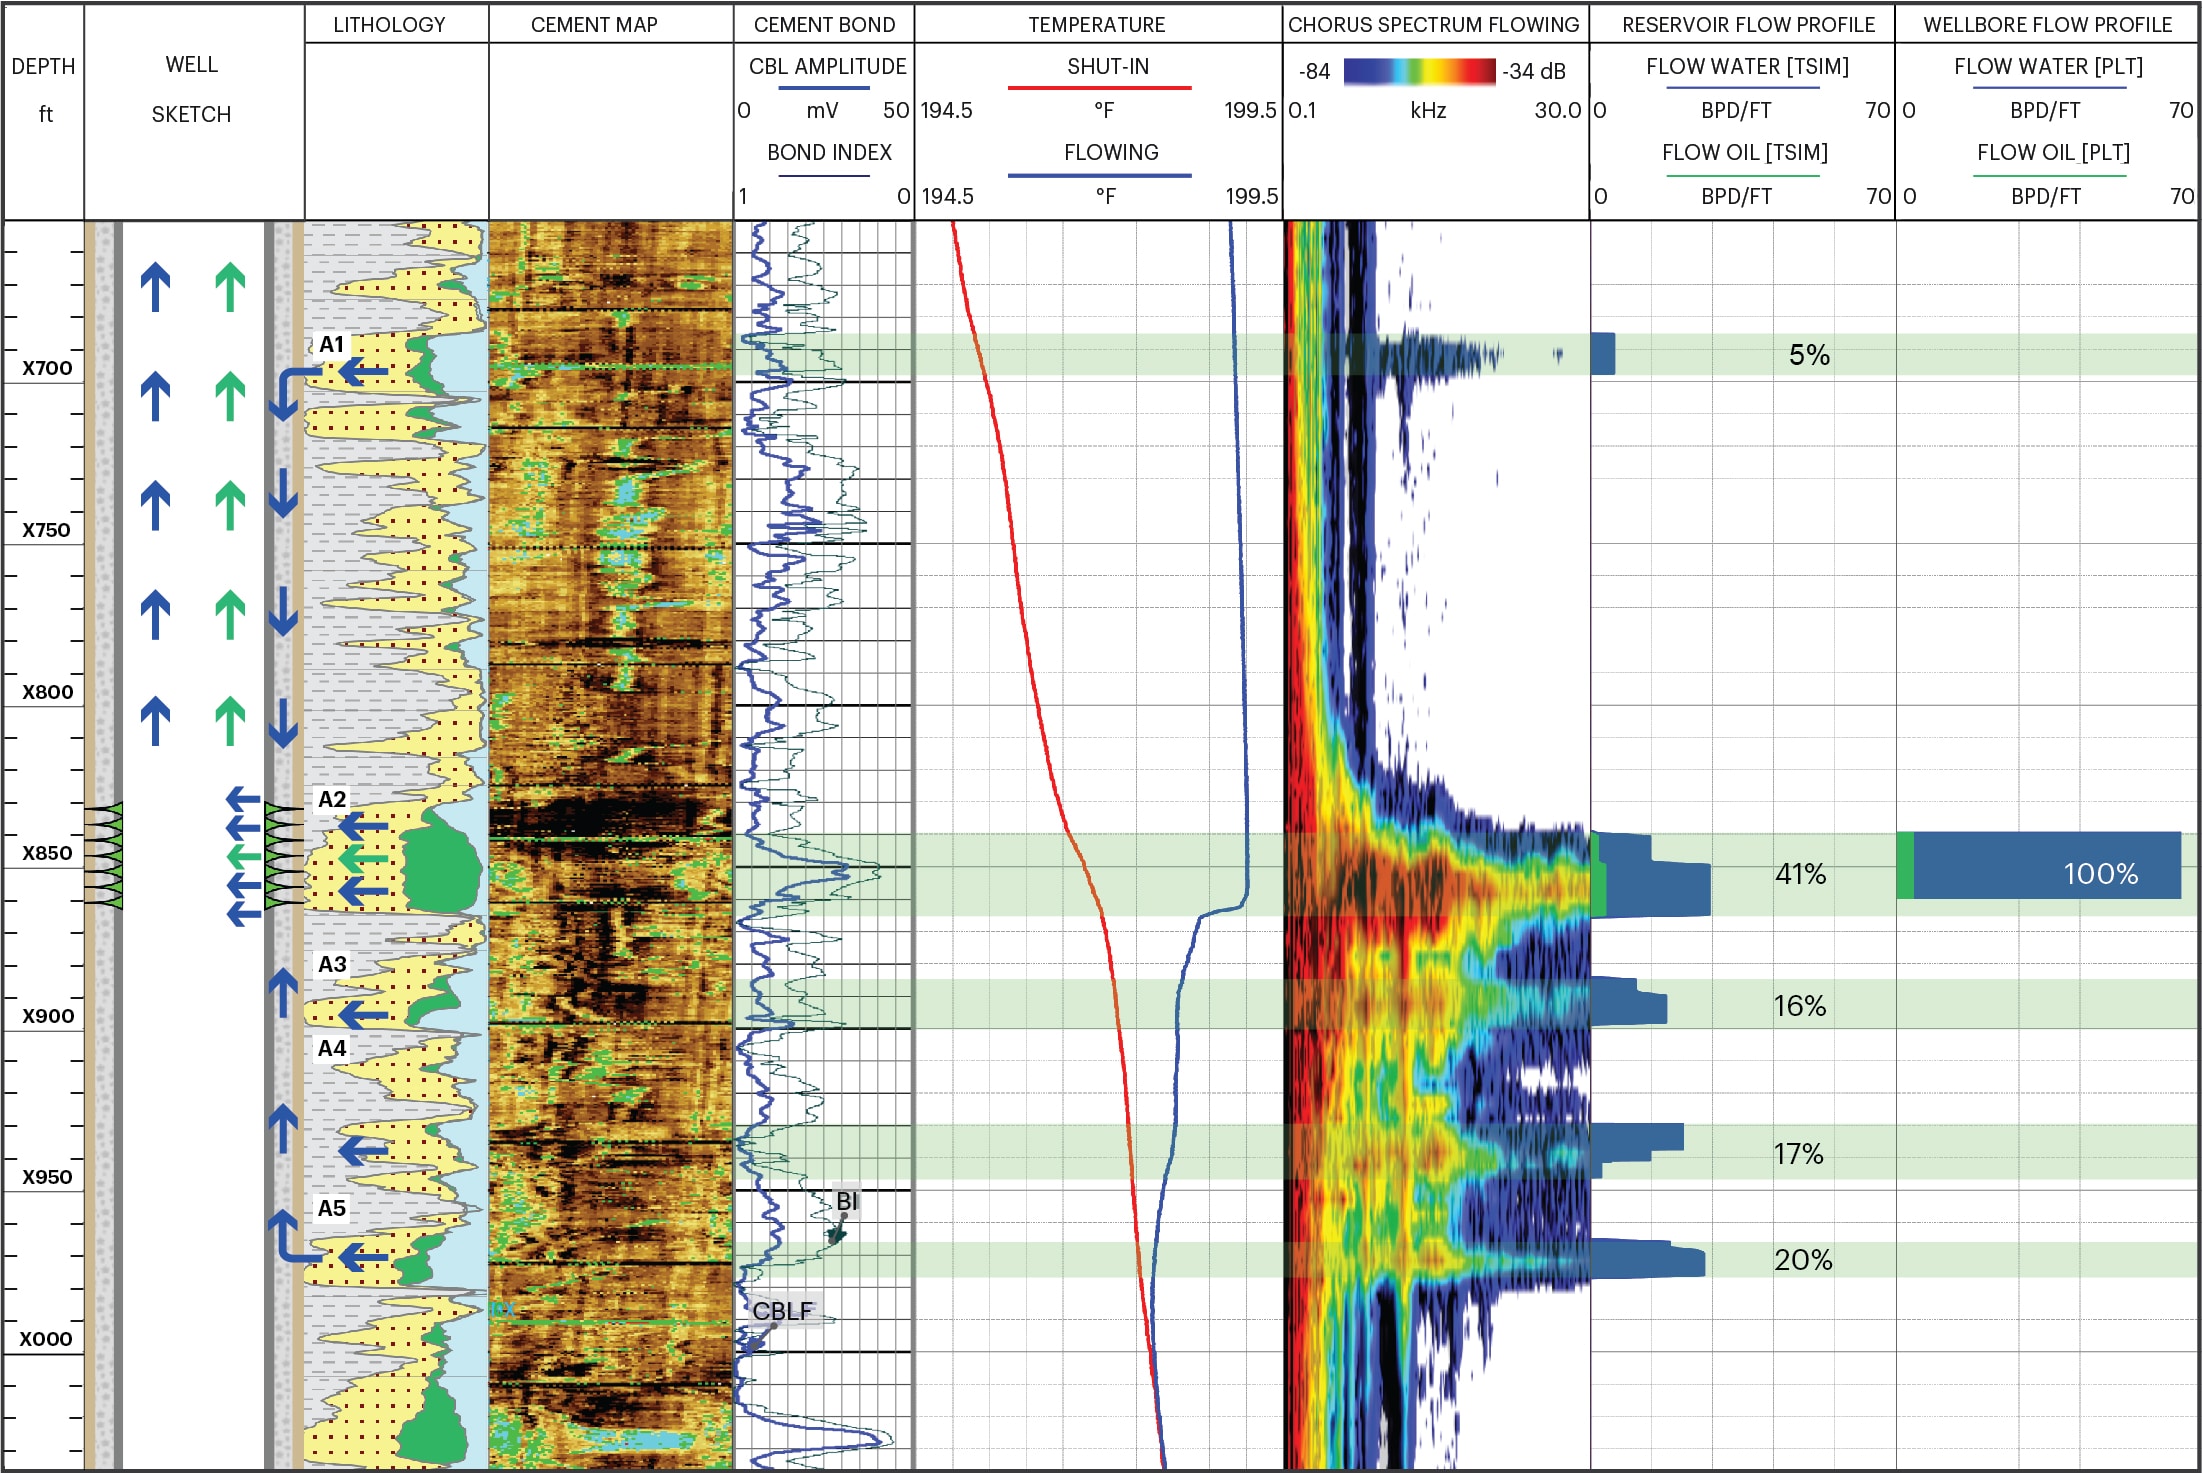
A deviated production well was exhibiting an extremely high 95% water cut and the operator needed to establish the precise source of water production in order to plan an effective remediation.


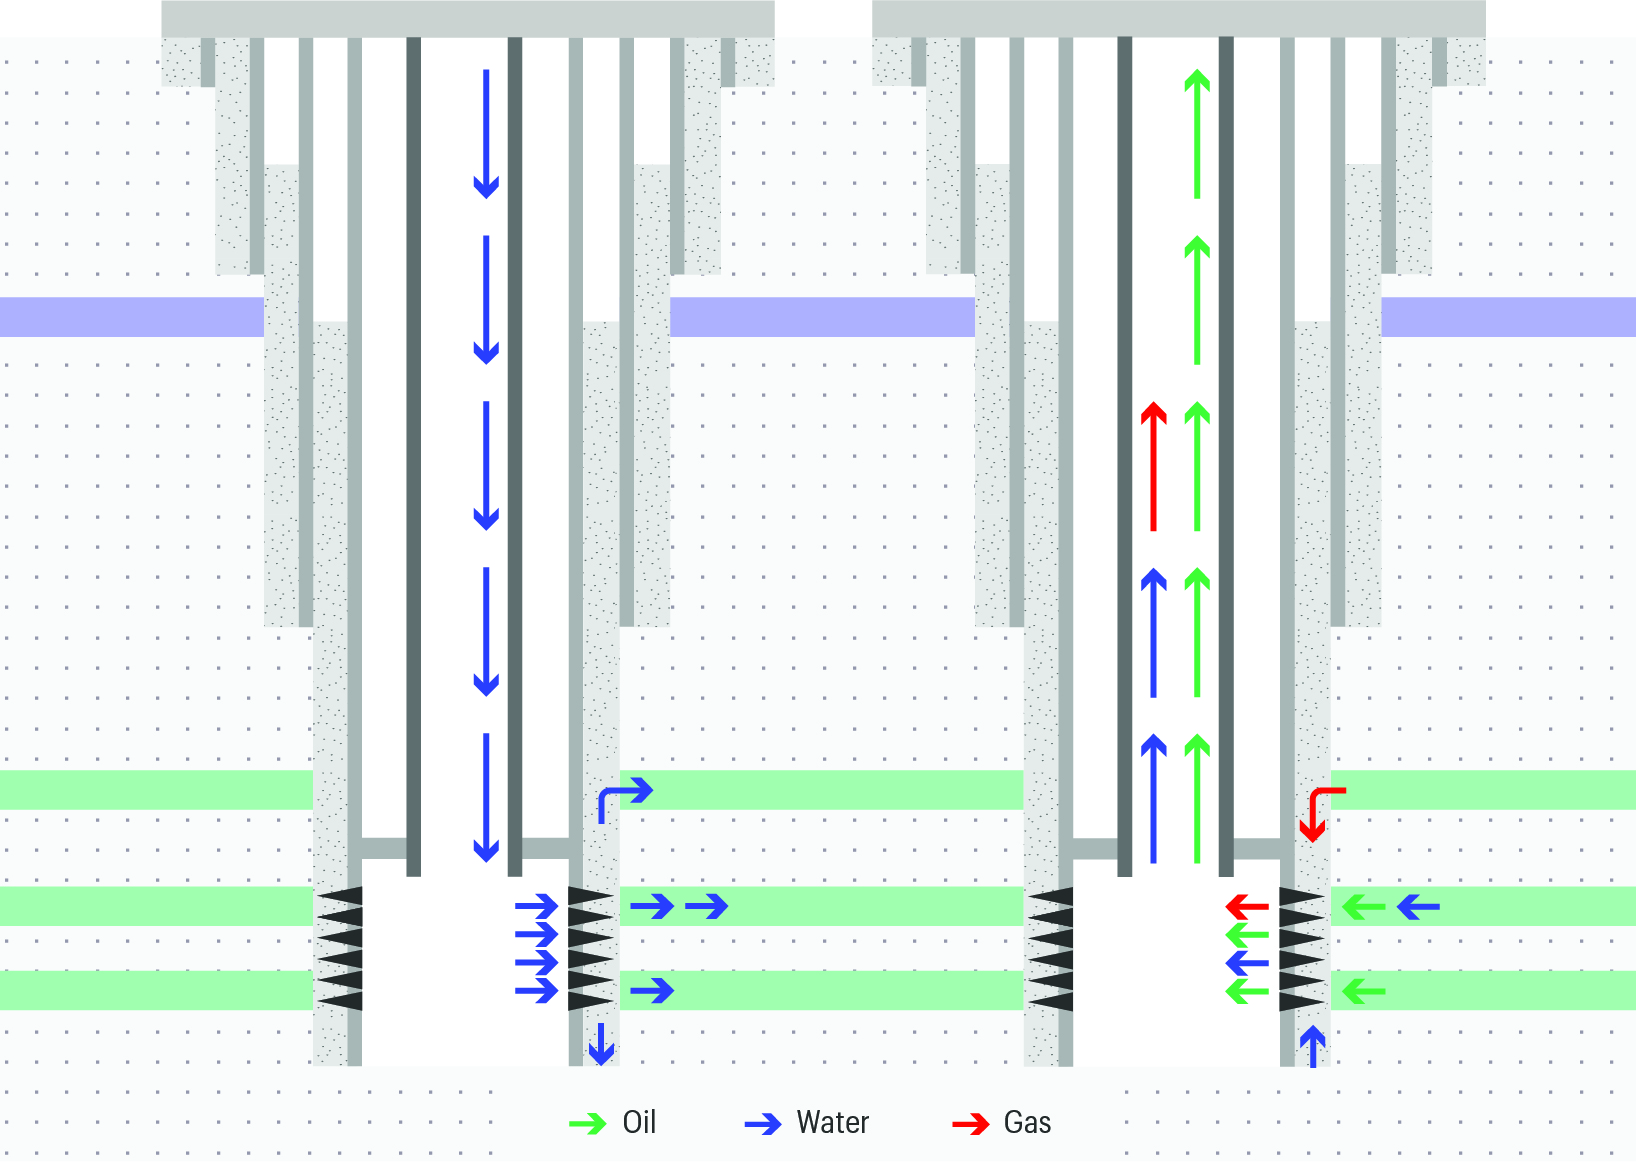
The operator was perplexed because the open hole interpretation indicated very low water saturation in the target reservoir, suggesting that the water may be coming from another formation, or that the reservoir was experiencing water break-through. Conventional production logging diagnostics [PLT’s] would show where the water was entering the wellbore, but not necessarily its true source behind casing.

Total-Flow-well-sketch
Total Flow locates and quantifies wellbore flow and – critically – reservoir flow to reveal the dynamic interplay between both.

Solution

The operator selected TGT’s ‘Total Flow’ product to understand the flow dynamics of the well system and uncover the true source of excess water. Total Flow is delivered by the ‘True Flow’ diagnostic system.


TGT’s diagnostic systems combine several proprietary technology platforms that share a common structure and workflow comprising of ‘programmes & methods’, ‘tools & measurements’, ‘processing & modeling’ and ‘analysis & interpretation’.


The True Flow system uses four platforms, Chorus, Cascade, Indigo and Maxim, and each has a specific role. Chorus is used to record and analyse the acoustic energy produced by fluid flow throughout the well system and its role in this case was to help analysts pinpoint flow activity behind casing. Cascade uses proprietary thermofluid modeling to calculate flow profiles and Indigo provided a number of complementary measurements, including temperature and conventional production logging [PLT] information. Maxim is the digital workspace where analysts developed the pre-survey diagnostic programme and carried out post-survey processing, data integration, modeling and data analysis.


The diagnostic programme in this case called for the well system to be surveyed in flowing and non-flowing states in order to expose the active flowing zones.

CS003-Total-Flow-Logplot
True Flow diagnostics in this production well show that more than 60% of produced water is not coming from the perforated reservoir unit A2. Whereas conventional PLT results imply 100% of the water is coming from the reservoir unit.

Result

The results revealed approximately 40% water production from the perforated reservoir A2, and the 60% from four additional behind-casing formations A1, A3, A4 and A5 [See logplot].


The Chorus spectrum in the logplot clearly shows the relative flow activity from each of the five zones, and Cascade modeling has quantified the respective flow rates.


Open hole data confirmed that each formation was water filled and the analyst concluded that water was channeling behind casing. The cement evaluation map indicated poor cement placement corroborating the presence of unwanted flowpaths through the cement.


Equipped with an accurate and complete flow diagnostic of the well system, the operator was able to target an effective remediation plan.