Home Resources CS008 Sand Flow
Case study
Identifying proppant backflow enhances multistage hydraulic fracturing programme
Sand Flow Resource ID: CS008

Challenge

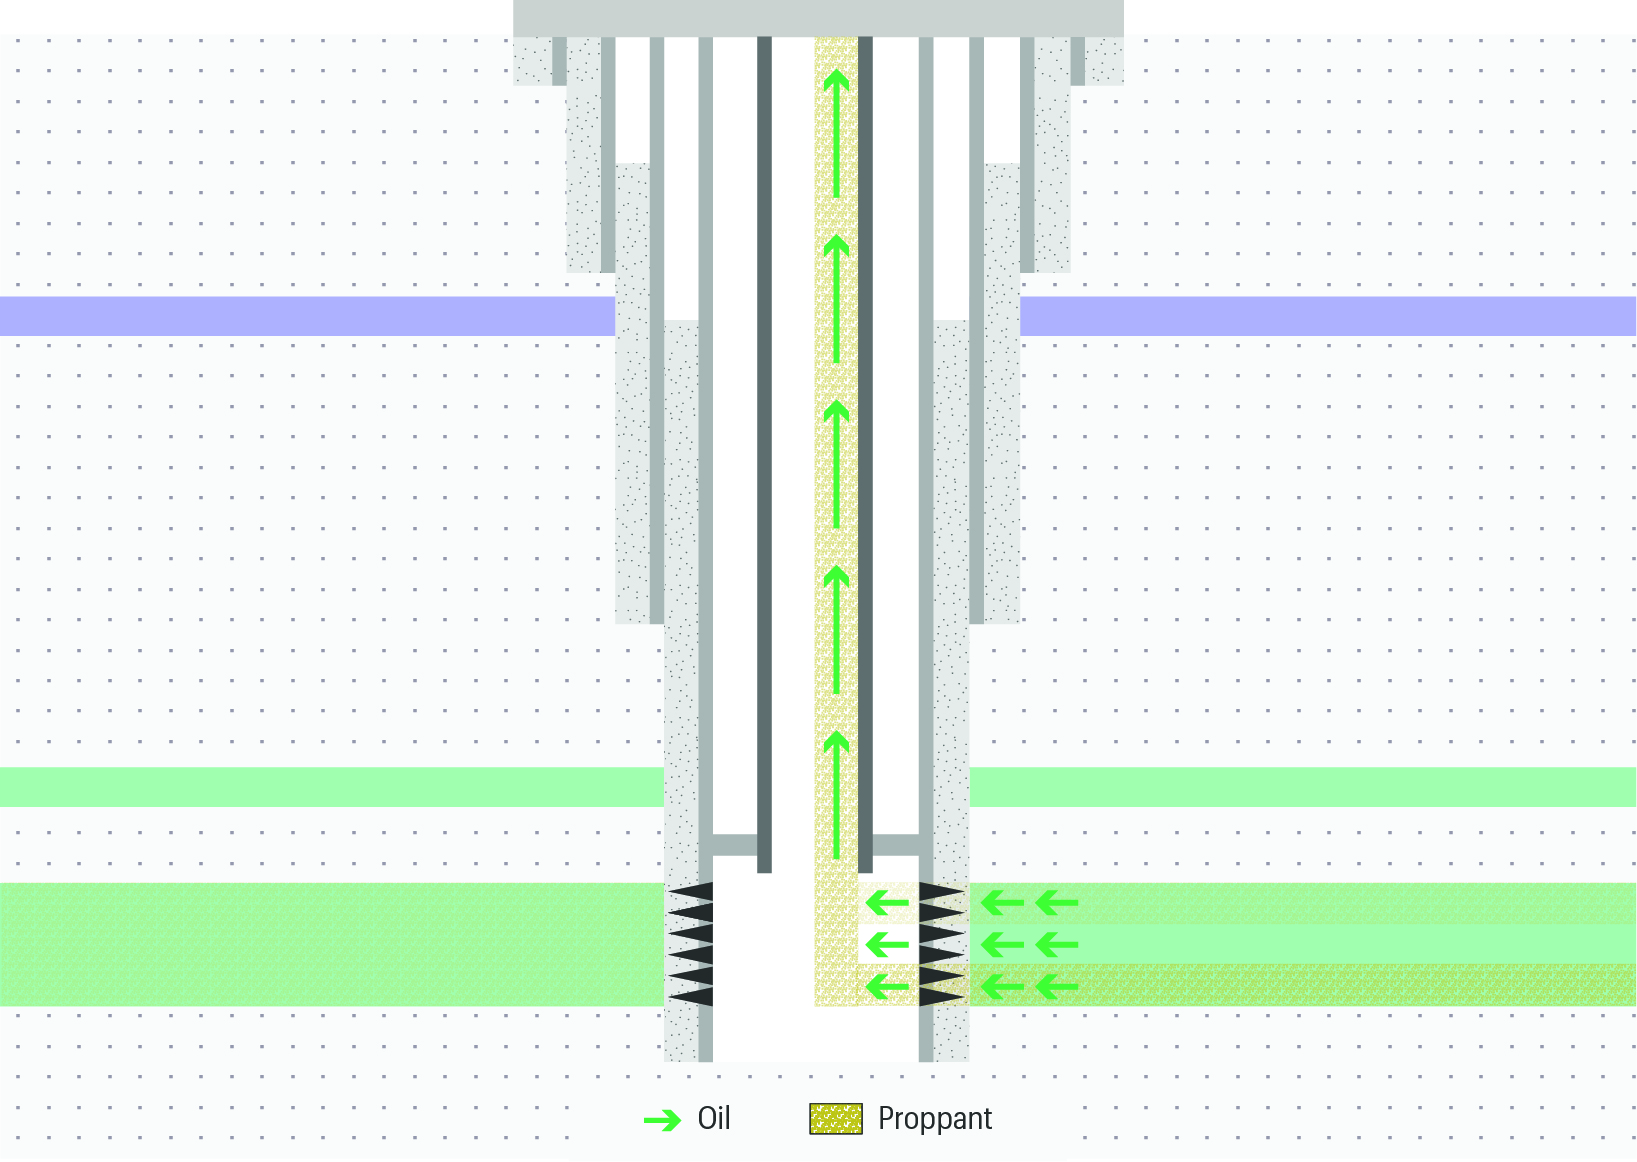
Hydraulic fracturing creates a system of fractures by applying a high differential pressure to the formation. The proppant used to keep the induced fractures open may flow back into the well or to other parts of the well system. The ability to monitor proppant flow gives operators a clearer understanding of well behaviour and helps them to optimise the design of hydraulic fracturing operations elsewhere in the field.


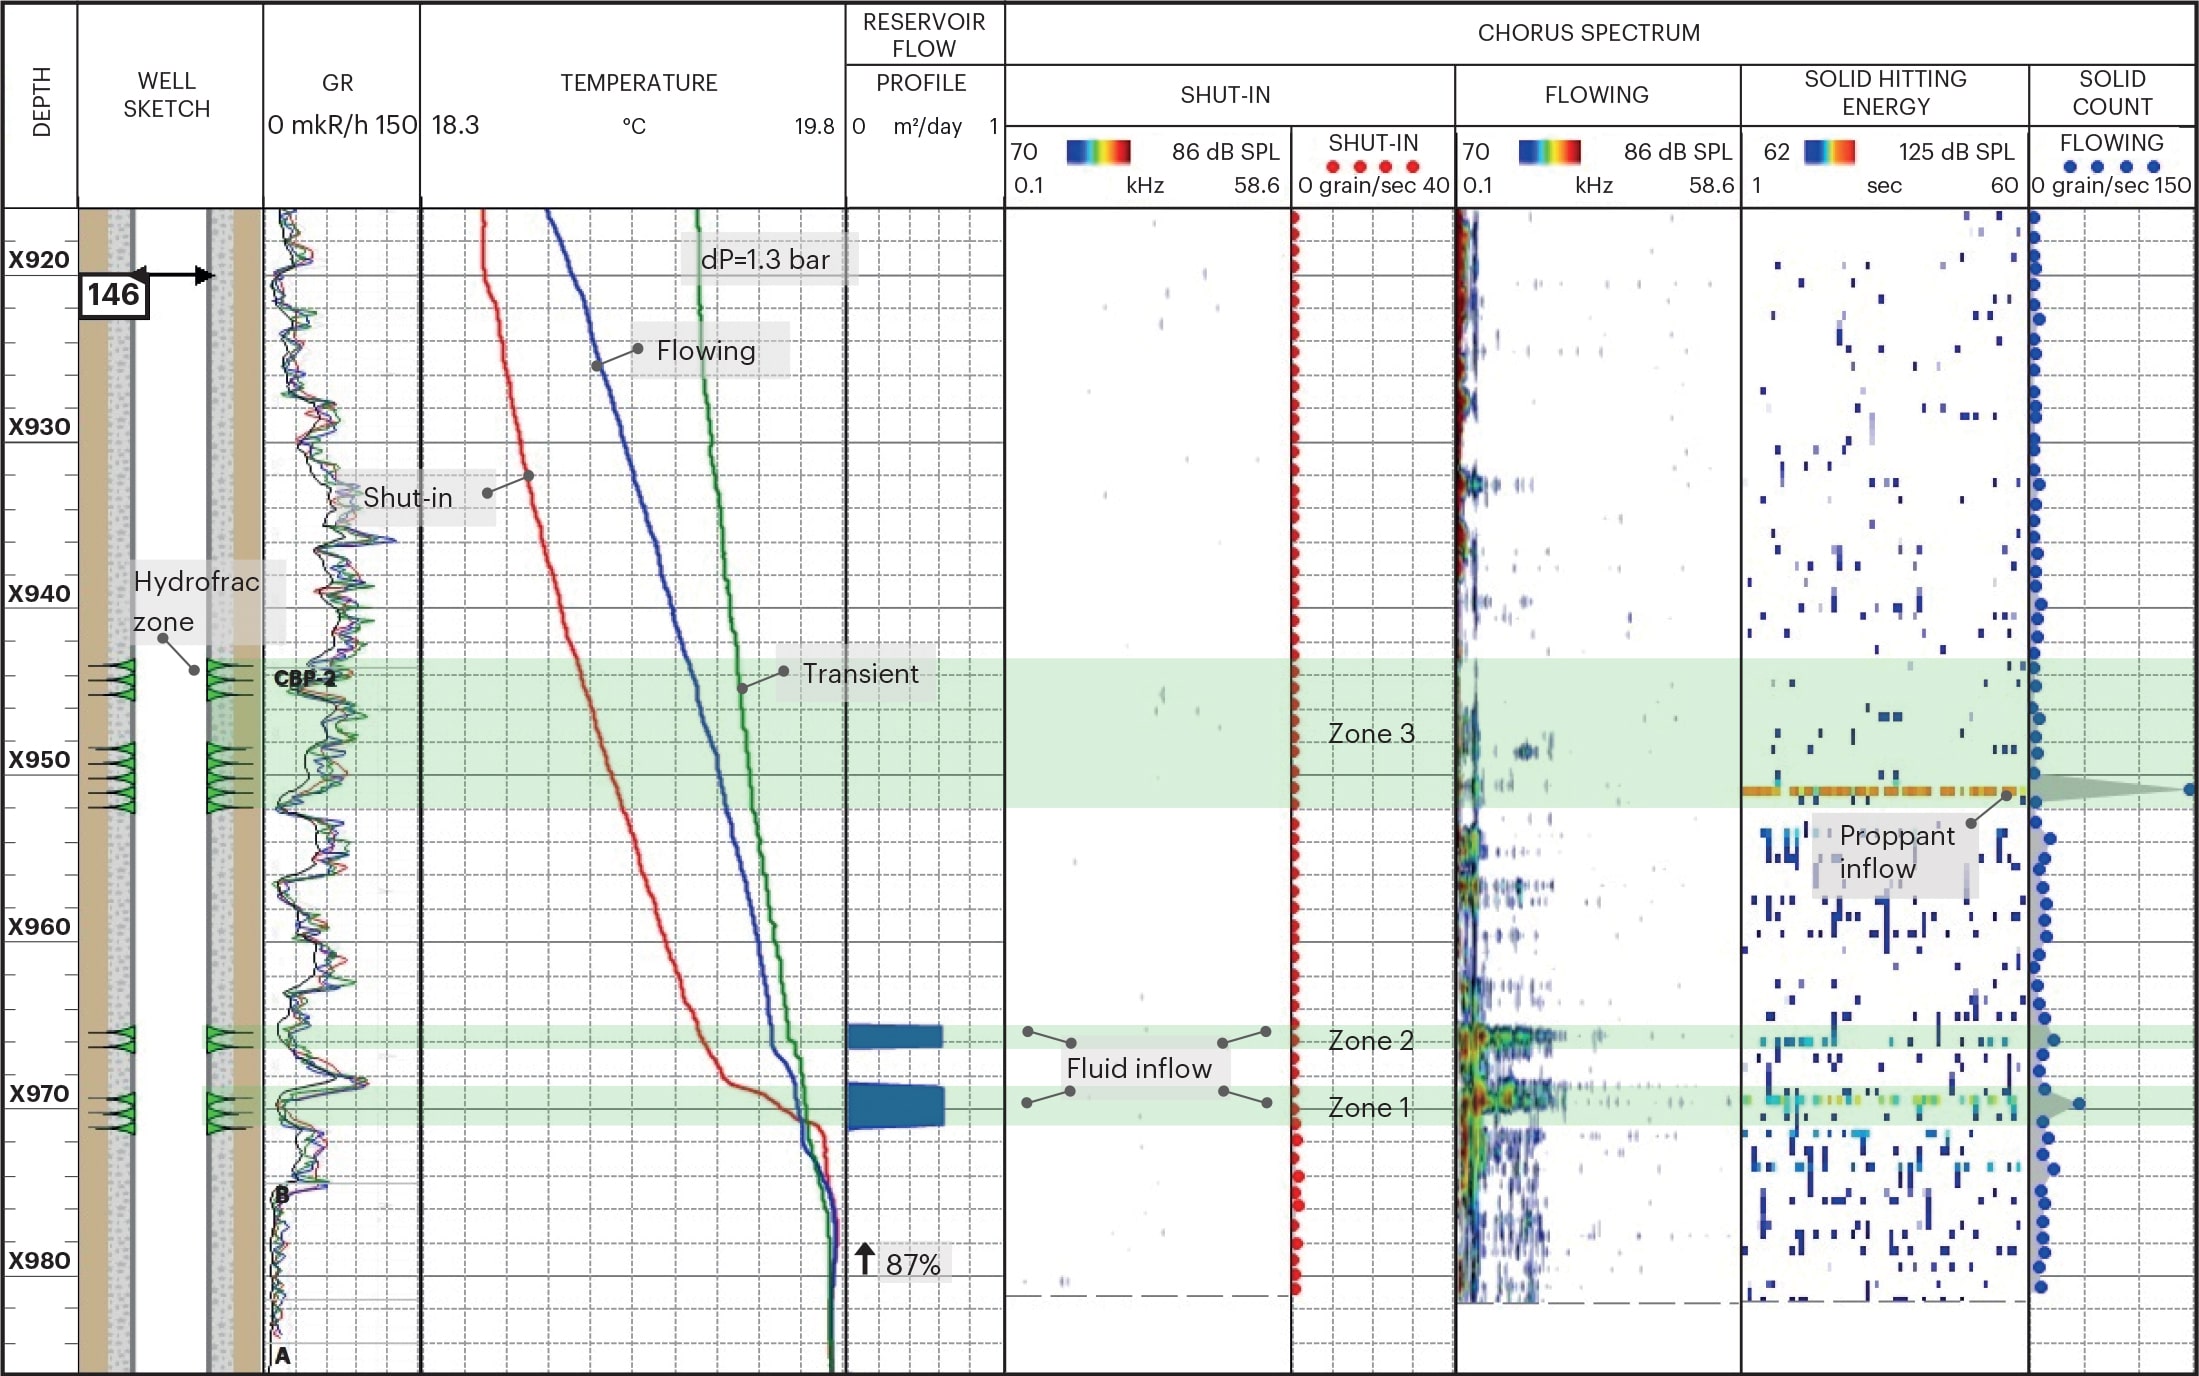
Until now diagnostics have not been able to locate solid particle inflow intervals. The focus of this project was to devise and deploy acoustic technology that would deliver reliable results and identification of proppant backflow zones.

Sand-Flow-well-sketch
Sand Flow precisely locates sand entry to the wellbore and provides a qualitative sand count, clearly identifying problem zones, even in turbulent flow conditions.

Solution

TGT’s Sand Flow product is designed to identify the locations where solid particles are entering the wellbore and to provide a assessment of solid particle count. Sand Flow is delivered by the True Flow diagnostic system using Chorus technology. Using time-domain not frequency-domain, the Chorus diagnostic system approach is entirely different for Sand Flow versus other Flow products.


The Chorus platform acquires acoustic signals associated with the impact of solid particles on the body of the tool. It uses a neural network to analyse this acoustic signal and thus to identify proppant backflow intervals. This well had an interval of possible proppant backflow where a hydraulic fracturing job had been performed in one out of three zones. This case was a field test to determine TGT’s ability to detect solid particles in flow.

CS008-Sand-Flow-Logplot
Chorus platform confirmed that Zone 1 and Zone 2 were producing fluid, but no solid particles (proppant). Whereas, Zone 3, which had been previously hydraulic fractured, was producing a little fluid but a large volume of proppant.

Result

Analysis of the time-domain Chorus data conducted in TGT’s Maxim digital workspace pinpointed the proppant inflow interval in Zone 3 (See logplot) and provided a qualitative solid particle count. The case also used the Total Flow product which indicated there was fluid inflow at zones 1 and 2, but not at zone 3.


Proppant backflow was identified exactly where the operator had conducted hydraulic fracturing, which is a clear indication that the fracture was not working as per the design intent. Hence the hydraulic fracturing needed complete reassessment and re-design.


Combining the assessment of solid particle flow intervals with the determination of the fluid inflow profile will greatly improve hydraulic fracturing.